|
You can easily debug PHP with PhpED's PHP Debugger. Setting up your system to debug php scripts can be tricky but PhpED's Settings Wizard can take care of the majority of the debugging configurations.
The Settings Wizard helps you set up your PhpED Project.
It performs the following steps to help you start to debug PHP:
- Settings Wizard collects the input from the user to determine the location of the web server, PHP interpreter and PHP Scripts to run and debug. After that it uses dbg-wizard.php to check the installed PHP and the presence of dbg - NuSphere's PHP Debugger. If the Wizard detects certain problems, it will prompt you for the permission to fix them or simply warn you about them.
- Once the server side verification is done the Wizard will determine the location of the Project files with respect to Document Root. The Project root can be inside of the Document Root, identical to Document Root or it can contain the Document Root - which is usually the case when the project is used for multiple websites or if the user decides to make the project root on top of the actual website and some utility libraries used for it.
- Once the server side verification and project settings are done, the wizard starts to debug dbg-sample.php - php sample script. It checks the working of break points, run-to-cursor, step-in, continue and eval functionality of the PHP Debugger
As the result of the running of Settings Wizard you will see the Project Properties setup in the way you can start debug PHP scripts in your PhpED Project.
How To Debug PHP with Settings Wizard
To debug PHP open PhpED's Project Properties and follow a few simple steps:
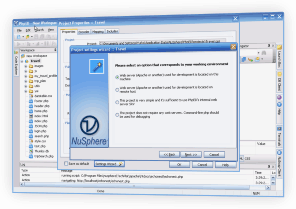
- Click on Settings Wizard Button to start the Wizard
- Select an option you will use to debug PHP scripts in your Project. Your environment can be one of the following:
- Web server used for development is located on the same machine with PhpED
- Web server used for development is located on remote host
- Internal PhpED Web server (Srv) can be used to run and debug PHP scripts
- Run and Debug using command line PHP
|
 |
 |
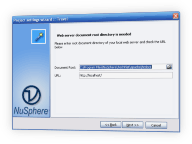
- Once the option for debugging environment is selected the Settings Wizard will prompt you with the series of questions related to the location of your PHP scripts, web server's Document Root and the website that you are going to debug. For example, this is the Wizard's prompt for the input to debug PHP on the same machine:
|
 |
 |
|
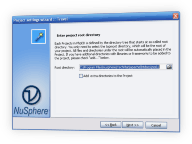
The prompts will vary based on the options selected in the Wizard, however all options will require you to set the Project Root Directory and also provide you with the opportunity to add additional directories to your Project.
|
 |
 |
How does Wizard check that you are ready to debug php?
|
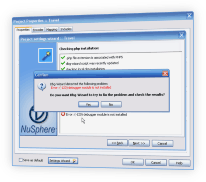
Once the Wizard collects the necessary input it performs the series of operations to prepare the system and install the components needed to debug php scripts. For example, the Settings Wizard will run dbg-wizard.php script and verify the proper installation of PHP Debugger. It will warn you about the errors and prompt to fix them when possible, as shown on the example
|
 |
 |
How to add extra directories to the project?
Sometimes you may want to debug PHP scripts located in the directories outside of your Project Root. To ensure that PHP Debugger works properly in these scripts you need to map these additional or as we call them extra directories on the server to your local folders. You can do it by checking Add Extra Directories box in the Wizard.
Settings Wizard will help you start to debug PHP in just a couple of minutes. You can see PHP Debugger in action when you Download a free trial of NuSphere's PHP IDE today!
|