|
Ask any experienced PHP developer about the toughest part of software development and the answer is almost always the same: performance. Performance often takes a back seat during development, but once the application is deployed to real customers it quickly becomes the biggest issue. Code that runs at the speed of light against three records on a local network can crawl in production. Which line of code is the hottest? Which functions are called the most? Which queries are dragging the page down? NuSphere PhpED's PHP Profiler answers these questions, and this tutorial walks through how to use it.
For information about supported platforms and how to install the PHP Debugger and Profiler modules, please see the debugging PHP on various platforms page.
PHP Performance Explorer (FlameGraph Profiler)
PhpED 22 introduces a brand-new PHP Performance Explorer — a modern sampling profiler with a rich, interactive UI based on the Firefox Profiler engine and reworked to natively support PHP. Instead of instrumenting every function call, it periodically captures the current call stack, so the overhead stays low while still producing a statistically accurate picture of where time is spent.
The Performance Explorer presents the captured data through a synchronized Timeline, Call Tree, Flame Graph and Stack Chart. Drag a range on the timeline to zoom into an interesting interval and the panels below recompute on the fly. Sort the Call Tree by self time to surface true hotspots, switch to the Flame Graph for a one-glance view of which frames dominate, or use the Stack Chart to see whether a function is called once or in a tight loop. Powerful filters and transforms — search, invert call stack, focus, merge, collapse and drop — let you cut through thousands of samples and quickly move from "it feels slow" to "function X accounts for 40% of the time". Read more about the NuSphere FlameGraph Profiler.
The classic line-level PHP Profiler described below remains fully supported and is still the right tool when you need precise per-line timings, hit counts, memory deltas or SQL query timing.
Note: When the FlameGraph profiler is selected in the profiler dropdown, the classic profilers will not be executed. Switch back in the dropdown when you need the classic per-line, memory or SQL views.
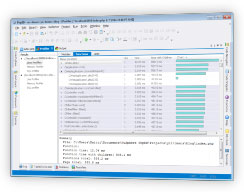
How to tune up performance of a PHP application
Tuning a PHP application starts with finding the bottleneck. You want to know:
- Which PHP scripts take the longest to run
- Which lines of code, functions and class methods consume the most time
- Which lines, functions and methods allocate or hold the most memory
- Which lines, functions and methods are visited the most (highest hit counts)
- How these numbers change across repeated runs of the application
|
 |
 |
How to use PhpED's PHP Profiler
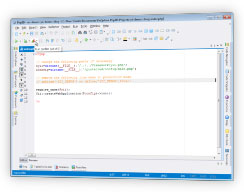
With a PHP script open in PhpED, start the profiler by pressing the Run Profiler button on the PHP debugger toolbar or by hitting ALT-F9. The Run Profiler button also exposes a dropdown listing scripts previously profiled.
|
 |
 |
|
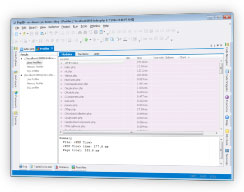
As the script runs, PhpED's PHP Profiler collects execution data and presents it in the Profiler window in an easy-to-read, graphical form.
|
 |
 |
Which PHP scripts take the longest to run
PhpED's PHP Profiler tells you which scripts are the most time-consuming. The columns in the output table show:
- Number of hits for each line of code
- Average execution time of each line
- Average execution time of all PHP code called from that line (Time with children)
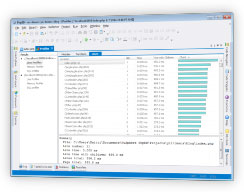
A Chart column visualizes the relative execution time of every line. The most time-consuming line is set at 100% and the rest are shown as fractions of that interval.
|
Every column can be sorted, giving you a quick way to view the performance profile from any angle. In the illustration below, line 11 of index.php was visited once and ran for 0.005 ms by itself, but the calls it made took 656 ms in total — making it the longest Time with Children line. Hardly surprising for index.php.
|
 |
 |
Which lines, functions and methods take the most time
|
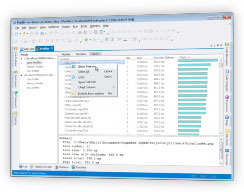
The PHP Profiler lets you jump straight from the output table to the source. Double-click an entry in the Location column (or pick Show Source from the popup menu) and PhpED opens the corresponding line in the editor. The example below highlights the slowest line according to the profiler — line 11 of index.php, with a Time with Children of 656 ms.
|
 |
 |
|
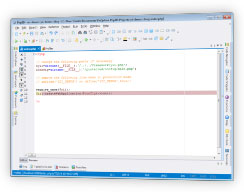
Double-clicking the index.php entry in the Location column opens the file in the editor and highlights line 11, as illustrated below.
|
 |
 |
Which lines, functions and methods are visited the most
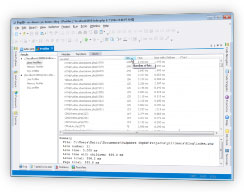
The PHP Profiler shows how many times each line of PHP code was visited during execution. Like any other column, the Hits column can be sorted in either direction — sort it descending to instantly see the most-visited lines.
See how to display hits per function and method here.
|
 |
 |
Which lines, functions and methods consume the most memory
|
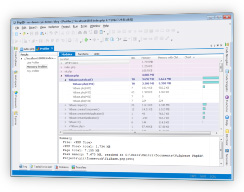
Just like the Line profile, the PHP Memory profile in PhpED shows where the application allocates or releases the most memory. Sort the Memory tab by clicking the header, double-click the top entry, and PhpED jumps to the corresponding line of source code.
|
 |
 |
How to find the longest-running SQL queries in PHP code
|
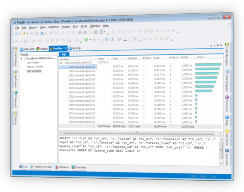
To profile every SQL query in your PHP code, enable SQL profiler from the Profiler menu before running the profiler. The results then include an SQL Profiler view with the full list of SQL calls, their fetch and execution times per line, and a visual chart.
|
 |
 |
Learn more about PHP SQL Profiler
How the numbers change across repeated runs
|
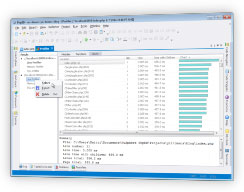
The PhpED PHP debugger keeps results from previous profiler runs. Use the left and right arrow buttons on the Profiler toolbar to navigate between snapshots and compare them.
|
 |
 |
|
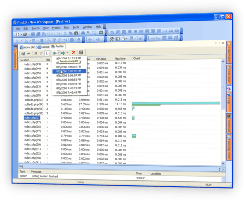
The same buttons also expose a dropdown listing previous results with their timestamps.
|
 |
 |
This tutorial walked through the main features of PhpED's PHP Profiler and how to use them to quickly find and eliminate bottlenecks in your PHP scripts. Combined with the new PHP Performance Explorer in PhpED 22 and PhpED's PHP debugger, it gives you a complete toolkit for performance work. Additional technical information is available on the NuSphere Forum. Download a free trial today!
|