PHP SQL Profiler in PhpED
|
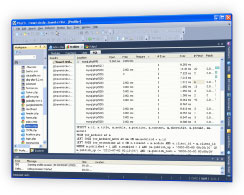
In addition to general PHP profiler that allows you to analyze the code performance in order to find bottlenecks in the code, PhpED also provides PHP SQL profiler to trace SQL queries made in PHP code, the number of times they are called and the break down of their open, execution, prepare and fetch results times. The following databases are supported: MySQL, MySQLi, PostgreSQL, Oracle, MSSQL, and all databases accessible with PDO classes.
How to Profile SQL queries in PHP Code
- Open a project containing php scripts you want to analyze.
- Open the starting file of the project in the editor.
- From the drop down list in Run Profiler toolbar item select the profiler options that you want to use
- Line Profiler to analyze the times of the execution and numbers of calls to PHP methods and functions in your code
- SQL Profiler analyze SQL queries executed in PHP code
- To run the profiling process press Run Profiler button on the debug toolbar or select Run > Run profiler or press Alt+F9.
- Profiler window will appear automatically on competing the profiling session.
- Analyze the code profiling results in the profiler window.
|
 |
 |
How to Use the results of PHP SQL Profiler
PHP SQL profiler provides the following options to use for the inspection of the results and php code navigation
- Location. Shows the code lines where SQL query is executed.
- Open. Shows the time spent to open connection to the database
- Free. Shows the time spent to free all the associated resources
- Prepare. Shows the time spent to prepare SQL query (if prepare is used)
- #Exec. Shows the number of times corresponding SQL query is executed during the run of the profiler
- Exec. Shows the time of SQL execution
- #Fetch. Shows the number of times SQL results were fetched during the profiler run
- Fetch. Shows time spent to fetch this SQL results
- Chart. Shows the relative value of every SQL. The highest value is assigned with 100%, while the others are shown as against to this one. In the popup menu you can select any output column to be displayed in the chart.
To show/hide the profiler window:
- First time use [Run Profiler] button on the debug toolbar or select Run > Run profiler or press Alt+F9.
- Close the window by selecting Close from the popup context menu or use Ctrl+F4
- You can bring up the profiler window again. Select Tools > Show profiler.
- Profiler accumulates the results and keeps them with the Workspace
|
|
 Download NuSphere PHP IDE Download NuSphere PHP IDE
Download a free trial of the fast PHP EDitor and robust Integrated Development Environment for PHP.
|
 Buy NuSphere PhpED® now Buy NuSphere PhpED® now
|
 Special Team4 Offer Special Team4 Offer
Get 4 copies of PhpED for the price of 3!
Optimum solution for development teams.
|

|
|
Need more than 4 licenses? Contact Us for more quantity discounts, please use "Ordering/Payment issue" subject on the form.
|
|
|