HOWTO: Run debug session?
I. IDE
 If you you have a project
created in PhpED IDE and you use either 3rd party web server or SRV local WEB server shipped with PhpED or you want to debug with
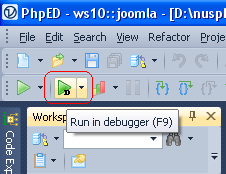
php cli executable, you can open PHP script that your want to debug in the editor and click Run in debugger (F9) button like shown on the screenshot. If you you have a project
created in PhpED IDE and you use either 3rd party web server or SRV local WEB server shipped with PhpED or you want to debug with
php cli executable, you can open PHP script that your want to debug in the editor and click Run in debugger (F9) button like shown on the screenshot.
After debug session has finished and you got the page rendered in the browser, all subsequent clicks on the URLs or submit buttons will trigger
debugger again. In most cases it's exactly what you need. Otherwise, just uncheck Run->Debug session and debugger will trigger only once.
NOTE: if submit or navigation is done to a different domain name or with different protocol used (HTTPS vs HTTP) debugger won't trigger implicitly
II. Debugger Toolbar
 You can use Debugger Toolbar available for Internet Explorer
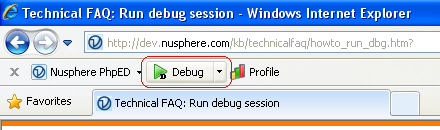
browser. With this feature, you can navigate to the page you want to debug, and click Debug button on the toolbar. You can use Debugger Toolbar available for Internet Explorer
browser. With this feature, you can navigate to the page you want to debug, and click Debug button on the toolbar.
After debug session has finished and you got the page rendered in the browser, all subsequent clicks on the URLs or submit buttons will trigger
debugger again. In most cases it's exactly what you need.
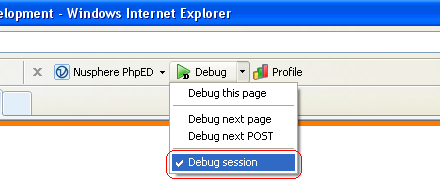 Otherwise, uncheck Run->Debug Session in
PhpED or Debug Session checkbox in the toolbar menu and debugger will trigger only once. Otherwise, uncheck Run->Debug Session in
PhpED or Debug Session checkbox in the toolbar menu and debugger will trigger only once.
 Debugger toolbar
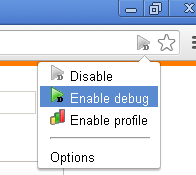
is also available for Google Chrome browser. Similarly, you can open your page in this browser, enable debugger in the popup menu and click
refresh to have debugger triggered. Note: to have this URL button appeared, it's necessary to add web domain name to the list of allowed
allowed domains on the toolbar Options page. Debug Session can be unchecked here too. This toolbar you can download from Google Chrome
hosting center on this page Debugger toolbar
is also available for Google Chrome browser. Similarly, you can open your page in this browser, enable debugger in the popup menu and click
refresh to have debugger triggered. Note: to have this URL button appeared, it's necessary to add web domain name to the list of allowed
allowed domains on the toolbar Options page. Debug Session can be unchecked here too. This toolbar you can download from Google Chrome
hosting center on this page
It's known that Debugger Toolbar maintained by 3rd party author is available for FireFox browser.
III. HTTP POST
<form ....>
<input type="hidden" name="DBGSESSID" value="1;d=1">
...
</form>
See this topic for further details about DBGSESSID syntax
IV. HTTP GET
http://myhost/myscript?DBGSESSID=1;d=1
V. Command line
php myscript.php DBGSESSID=1;d=1
VI. Environment variable
unix way:
set DBGSESSID=1;d=1 && php myscript.php
windows way:
set DBGSESSID=1;d=1
php myscript.php
VII. Debugger API
<?php
...
DebugBreak("1;d=1");
...
?>
VIII. Open URL
Run PhpED, Tools->Open URL, type target URL and check Run Debug Session
IX. Launch Box
Run PhpED, View->Launch Box. History of all "run with debugger" commands executed in the IDE is kept here. You can re-run any of them.
|